

A Local Lab for Debugging OpenTelemetry Collector Pipelines
By Nicolas Narbais
Use Docker Compose to prove that traces, metrics, and logs pass through each OpenTelemetry Collector pipeline before you debug the backend.
Introduction
When telemetry disappears, start at the first hop you control.
Your backend may be broken. Your trace may also have missed the Collector, your metric may have entered the wrong pipeline, or your log may have reached a pipeline with nowhere useful to go. Each failure needs a different fix.
This local Docker Compose lab gives you one Collector, test telemetry, and two local destinations. You will prove each hop before involving a production backend.
The Four Paths You Will Prove
The lab has four separate paths. Keep them separate while you debug.
| Signal | Entry point | First proof | Final proof |
|---|---|---|---|
| Traces | OTLP/gRPC on :4317 | debug exporter in Collector logs | Jaeger |
| Application metrics | OTLP/gRPC on :4317 | debug exporter in Collector logs | Prometheus scrape endpoint on :8889 |
| Logs | OTLP/gRPC on :4317 | debug exporter in Collector logs | Collector logs in this lab |
| Collector self-metrics | Collector runtime | :8888/metrics | Prometheus scrape job for :8888 |
The Collector’s /metrics endpoint describes the Collector. It is separate from the application metrics that pass through the metrics pipeline. Prometheus scrapes both in this lab, but from different endpoints.
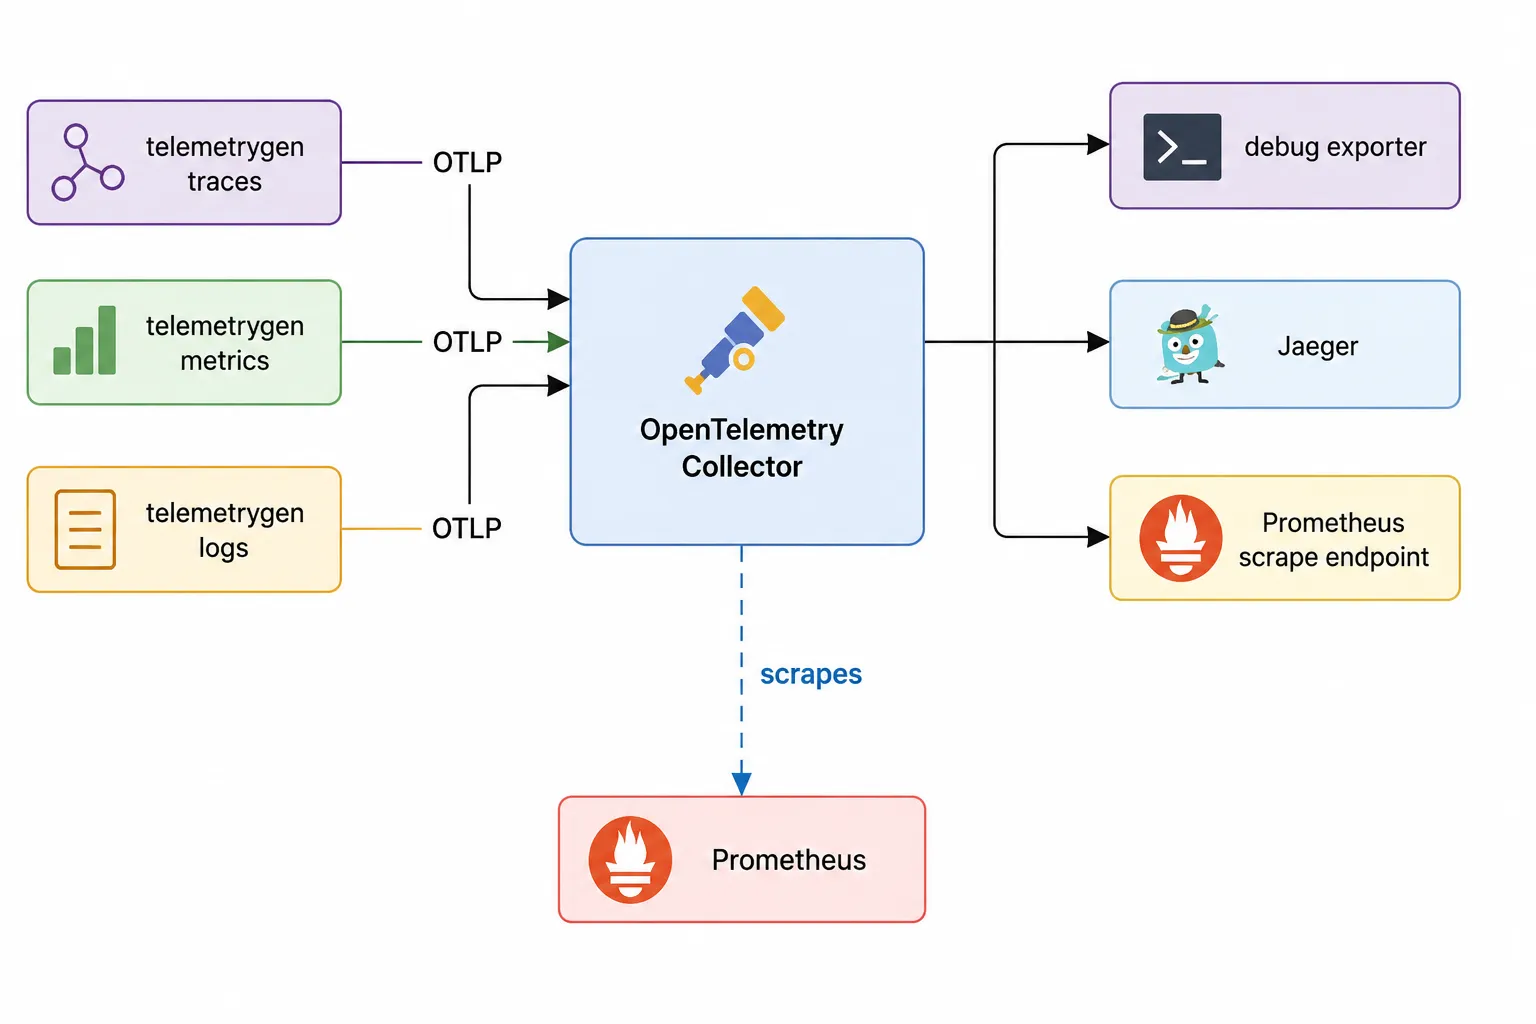
If you only remember one thing: prove the Collector works well before you debug the backend.
Build The Lab
You need Docker and Docker Compose. Create an empty directory with these files:
Create an empty directory and add three files:
docker-compose.yml
otelcol-config.yml
prometheus-config.yamlVersion note: the examples below use pinned image tags so the demo does not silently change under you. These versions were checked on May 30, 2026, ahead of publication. If something breaks later, check the relevant release notes for renamed metrics, config changes, or moved images.
The Docker Compose File
The Compose file starts the Collector, Prometheus, and Jaeger. It also defines three telemetry generators that you run on demand.
Create docker-compose.yml:
services:
  otel-collector:
    image: ghcr.io/open-telemetry/opentelemetry-collector-releases/opentelemetry-collector-contrib:0.153.0
    command: ["--config=/etc/otelcol-contrib/config.yaml"]
    volumes:
      - ./otelcol-config.yml:/etc/otelcol-contrib/config.yaml:ro
    ports:
      - "4317:4317" # OTLP gRPC receiver
      - "4318:4318" # OTLP HTTP receiver
      - "8888:8888" # Collector self-metrics
      - "8889:8889" # Metrics exposed by the prometheus exporter
    depends_on:
      - jaeger

  prometheus:
    image: prom/prometheus:v3.5.3
    command:
      - "--config.file=/etc/prometheus/prometheus.yml"
    volumes:
      - ./prometheus-config.yaml:/etc/prometheus/prometheus.yml:ro
    ports:
      - "9090:9090"
    depends_on:
      - otel-collector

  jaeger:
    image: jaegertracing/all-in-one:1.76.0
    environment:
      COLLECTOR_OTLP_ENABLED: "true"
    ports:
      - "16686:16686" # Jaeger UI
    # Jaeger's OTLP ports stay inside the Compose network.
    # The host only talks to the Collector on 4317 and 4318.

  telemetrygen-traces:
    image: ghcr.io/open-telemetry/opentelemetry-collector-contrib/telemetrygen:v0.153.0
    profiles: ["generate"]
    command:
      - traces
      - "--otlp-endpoint=otel-collector:4317"
      - "--otlp-insecure"
      - "--duration=30s"
      - "--rate=2"
    depends_on:
      - otel-collector

  telemetrygen-metrics:
    image: ghcr.io/open-telemetry/opentelemetry-collector-contrib/telemetrygen:v0.153.0
    profiles: ["generate"]
    command:
      - metrics
      - "--otlp-endpoint=otel-collector:4317"
      - "--otlp-insecure"
      - "--duration=30s"
      - "--rate=1"
    depends_on:
      - otel-collector

  telemetrygen-logs:
    image: ghcr.io/open-telemetry/opentelemetry-collector-contrib/telemetrygen:v0.153.0
    profiles: ["generate"]
    command:
      - logs
      - "--otlp-endpoint=otel-collector:4317"
      - "--otlp-insecure"
      - "--duration=30s"
      - "--rate=2"
    depends_on:
      - otel-collector
The telemetrygen services are behind a Compose profile. They do not run every time you start the stack. You run them when you want fresh telemetry.
Jaeger also accepts OTLP on 4317 and 4318 when OTLP ingestion is enabled (Jaeger deployment docs). In this Compose file, those Jaeger ports stay inside the Compose network. The host only talks to the Collector on 4317 and 4318.
The Collector Configuration
This config receives OTLP, prints every signal with debug, sends traces to Jaeger, and exposes pipeline metrics for Prometheus.
Create otelcol-config.yml:
receivers:
  otlp:
    protocols:
      grpc:
        endpoint: 0.0.0.0:4317
      http:
        endpoint: 0.0.0.0:4318

processors:
  memory_limiter:
    check_interval: 1s
    limit_mib: 256
    spike_limit_mib: 64

  batch:

exporters:
  debug:
    verbosity: normal

  otlp/jaeger:
    endpoint: jaeger:4317
    tls:
      insecure: true

  prometheus:
    endpoint: 0.0.0.0:8889
    resource_to_telemetry_conversion:
      enabled: true

service:
  telemetry:
    metrics:
      level: normal
      readers:
        - pull:
            exporter:
              prometheus:
                host: 0.0.0.0
                port: 8888

  pipelines:
    traces:
      receivers: [otlp]
      processors: [memory_limiter, batch]
      exporters: [debug, otlp/jaeger]

    metrics:
      receivers: [otlp]
      processors: [memory_limiter, batch]
      exporters: [debug, prometheus]

    logs:
      receivers: [otlp]
      processors: [memory_limiter, batch]
      exporters: [debug]
As always, the Collector does not activate a component just because you defined it. A receiver, processor, or exporter only runs when it is attached to a pipeline in the service section (Collector configuration).
The Prometheus Configuration
Create prometheus-config.yaml:
global:
  scrape_interval: 10s

scrape_configs:
  - job_name: otel-collector-self
    static_configs:
      - targets: ["otel-collector:8888"]

  - job_name: otel-collector-application-metrics
    static_configs:
      - targets: ["otel-collector:8889"]
This file scrapes two endpoints:
otel-collector:8888is the Collector’s own/metricsendpoint.otel-collector:8889is the endpoint created by the Collector’sprometheusexporter for metrics that flowed through the metrics pipeline.
Prometheus can also receive OTLP metrics directly over HTTP when started with --web.enable-otlp-receiver (Prometheus OpenTelemetry guide). This demo does not use that path. Keeping Prometheus in pull mode makes the two local metrics paths easier to see.
This is a deliberate simplification. You can add OTLP ingestion later, but start with the version where every scrape target has a clear job.
Run The Lab
Start the Collector, Prometheus, and Jaeger:
docker compose up -dCheck that the containers are running:
docker compose psOpen Prometheus in your browser:
http://localhost:9090Open Jaeger in your browser:
http://localhost:16686Send Test Telemetry
The stack starts empty. Send each signal through the same OTLP receiver:
Run all three generators:
docker compose run --rm telemetrygen-traces
docker compose run --rm telemetrygen-metrics
docker compose run --rm telemetrygen-logs
telemetrygen is part of the OpenTelemetry Collector Contrib repository and is intended for generating traces, metrics, and logs for testing and demos (telemetrygen).
The commands above send OTLP over gRPC to otel-collector:4317.
If your SDK uses OTLP over HTTP, override one command and point it at 4318:
docker compose run --rm telemetrygen-traces \
  traces \
  --otlp-http \
  --otlp-endpoint=otel-collector:4318 \
  --otlp-insecure \
  --traces=3
That catches a common local mistake: HTTP telemetry sent to the gRPC port, or gRPC telemetry sent to the HTTP port.
1. Prove The Collector Received Each Signal
Watch the Collector logs:
docker compose logs -f otel-collectorThe debug exporter proves that a signal reached the expected pipeline and its first exporter. It does not prove a later backend destination received the signal.
The exact output changes with Collector versions and verbosity level, but the shape is stable enough to recognize.
For traces, look for ResourceSpans:
ResourceSpans #0
ScopeSpans #0
Span #0
Name: lets-go
For metrics, look for ResourceMetrics:
ResourceMetrics #0
ScopeMetrics #0
Metric #0
Name: gen
For logs, look for ResourceLogs:
ResourceLogs #0
ScopeLogs #0
LogRecord #0
Body: log
If the Collector logs are silent after running telemetrygen, check these first:
- Is
telemetrygensending tootel-collector:4317from inside Docker? - Is the
otlpreceiver attached to the right pipeline? - Is the
debugexporter attached to that same pipeline? - Are you sending HTTP traffic to
4318and gRPC traffic to4317?
If the Collector logs stay silent after a generator runs, check the generator endpoint, the otlp receiver, the pipeline wiring, and the debug exporter in that pipeline. Check the protocol too: use 4317 for gRPC and 4318 for HTTP.
2. Prove Trace Export In Jaeger
Open:
http://localhost:16686In the Jaeger UI, pick the telemetrygen service and search for traces.
If you do not see traces:
- confirm
docker compose run --rm telemetrygen-tracescompleted without errors - check
docker compose logs -f otel-collectorfor debug exporter trace output - check the Collector config has
otlp/jaegerin the traces pipeline - confirm the Jaeger service has
COLLECTOR_OTLP_ENABLED=true
The host does not need Jaeger’s OTLP port published. The Collector reaches Jaeger through Docker DNS at jaeger:4317.
3. Prove Application Metrics In Prometheus
The metrics generated by telemetrygen flow through the Collector’s metrics pipeline and are exposed by the prometheus exporter on :8889. They do not appear on :8888, which exposes the Collector’s own runtime metrics.
In Prometheus, query:
{job="otel-collector-application-metrics"}If the metrics generator ran recently, you should see series from the Collector’s Prometheus exporter endpoint. Exact metric names can change with telemetrygen, but the job should return data.
4. Prove Collector Self-Metrics
The Collector’s /metrics endpoint tells you what the Collector is doing internally. This is where you check whether the Collector is accepting, refusing, exporting, or failing data.
From your host:
curl http://localhost:8888/metricsA successful response includes otelcol_* metrics. For example:
otelcol_receiver_accepted_spans_total{receiver="otlp",transport="grpc"} 12
otelcol_exporter_sent_spans_total{exporter="debug"} 12
In Prometheus, query the self-metrics scrape job:
{job="otel-collector-self", __name__=~"otelcol_.*"}For failures, start with receiver and exporter prefixes:
{job="otel-collector-self", __name__=~"otelcol_receiver_.*"}{job="otel-collector-self", __name__=~"otelcol_exporter_.*"}Metric names can vary across Collector versions and Prometheus translation settings, so prefixes are usually more useful than a perfect metric name on the first query.
Follow The First Broken Link
The otlp receiver accepts test telemetry on 4317 for gRPC and 4318 for HTTP (OTLP specification). The debug exporter is the first proof point. Jaeger and the Prometheus exporter are later destinations.
Start with the symptom, then inspect the first boundary that could explain it.
| Symptom | First place to check |
|---|---|
| No debug output | telemetrygen endpoint, receiver pipeline, debug exporter |
| Debug shows traces, Jaeger is empty | otlp/jaeger exporter and Jaeger OTLP setting |
| Prometheus self job works, app metrics are empty | telemetrygen-metrics, metrics pipeline, :8889 scrape target |
| App metrics work, self metrics are empty | service.telemetry.metrics, 8888 port binding |
| Works inside Docker, not from the host | published ports |
Three rules catch most local mistakes:
- From a Compose service,
localhostmeans that container. Useotel-collector:4317. - A receiver, processor, or exporter is inactive until it appears in
service.pipelines. - Use
4317for OTLP/gRPC and4318for OTLP/HTTP.
You are done when the Collector logs show ResourceSpans, ResourceMetrics, and ResourceLogs; Jaeger shows telemetrygen traces; Prometheus returns application metrics from otel-collector-application-metrics and otelcol_* metrics from otel-collector-self; and failed-export counters remain at zero.
Carry Collector Health Into Production
The lab exposes Collector self-metrics for Prometheus to scrape. In production, send the same metrics directly to your telemetry backend through service.telemetry.metrics.readers.
This reader cannot reuse a normal exporter such as otlp_http/tsuga. Pipeline exporters run only when a signal passes through service.pipelines; the telemetry reader exports the Collector’s runtime metrics directly. It needs its own otlp settings, but it can use the same endpoint and secret-backed environment variables as the regular exporter.
service:
  telemetry:
    resource:
      service.name: otel-collector
      deployment.environment.name: ${env:DEPLOYMENT_ENVIRONMENT_NAME}
    metrics:
      readers:
        - periodic:
            exporter:
              otlp:
                endpoint: ${env:TSUGA_OTLP_ENDPOINT}/v1/metrics
                headers:
                  Authorization: Bearer ${env:TSUGA_INGESTION_KEY}
                protocol: http/protobuf
The /v1/metrics suffix matters. A standard OTLP/HTTP pipeline exporter receives the base OTLP endpoint and adds the signal path itself. The telemetry reader targets the metrics endpoint directly.
Give Collector telemetry its own service.name, then watch queue depth, queue capacity, enqueue failures, send failures, and memory-limiter refusals. Those metrics tell you whether the Collector is becoming the source of missing evidence.
Keep the reader in the existing service: block. The format requires Collector 0.83 or later; check the deployed version’s documentation before copying it into an older configuration. Keep Collector health, pprof, zpages, and other diagnostic endpoints on private interfaces.
References: How to Operate an OpenTelemetry Collector and Collector Pipelines.
Optional Appendix
The main path above is intentionally small. Add these pieces only when they prove something you need.
Tail A Local Log File With filelog
The filelog receiver tails files and turns matching lines into OpenTelemetry log records (filelog receiver). You do not need it for the main path, but it is useful when the thing you need to test writes files.
Mount a local directory into the Collector:
otel-collector:
  volumes:
    - ./otelcol-config.yml:/etc/otelcol-contrib/config.yaml:ro
    - ./logs:/var/log/sample:ro
Add the receiver and attach it to the logs pipeline:
receivers:
  filelog/sample:
    include:
      - /var/log/sample/*.log
    start_at: beginning
    include_file_path: true

service:
  pipelines:
    logs:
      receivers: [otlp, filelog/sample]
      processors: [memory_limiter, batch]
      exporters: [debug]
Then write a line and watch the Collector:
mkdir -p logs
echo "hello from filelog" >> logs/app.log
docker compose restart otel-collector
docker compose logs -f otel-collector
Add Host Metrics With hostmetrics
The hostmetrics receiver collects CPU, memory, disk, filesystem, load, and network metrics (hostmetrics receiver). Keep it optional in this lab. Inside a container, host metrics can mean “container view” unless you add the right host filesystem mounts and root_path settings.
A starter receiver:
receivers:
  hostmetrics:
    collection_interval: 10s
    scrapers:
      cpu:
      memory:
      disk:
      filesystem:
      network:
      load:
Then add hostmetrics to the metrics pipeline receivers.
Add Collector Debugging Extensions
The Collector also has extensions for local troubleshooting:
extensions:
  health_check:
  pprof:
    endpoint: 0.0.0.0:1777
  zpages:
    endpoint: 0.0.0.0:55679

service:
  extensions: [health_check, pprof, zpages]
Publish ports only when you need them. These are local debugging tools. Keep them private.
Keep The Production Boundary Clear
This lab is a development harness. Production needs durable backends, authenticated and private transport, deliberate retry and queue settings, bounded metric dimensions, and tested Collector upgrades.
Run this lab before you investigate a production backend. Once you can identify the first broken link, you can narrow the incident without guessing.
References
- OpenTelemetry Collector
- OpenTelemetry Collector release v0.153.0
- OpenTelemetry Collector Contrib release v0.153.0
- Collector configuration
- Collector internal telemetry
- OTLP specification
- debug exporter package docs
- telemetrygen
- Jaeger deployment docs
- Prometheus release v3.5.3
- Prometheus OpenTelemetry guide
Written by
Nicolas Narbais
Nicolas Narbais builds, breaks, debugs, and scales observability systems using OpenTelemetry and modern telemetry pipelines. He shares practical, opinionated lessons to help engineers get better signal with less noise.
Olatuak Editorial Philosophy
Better signal, not more telemetry.
Olatuak helps platform engineers, SREs, and observability teams turn noisy telemetry into clear operational decisions without blindly collecting more data.